Reports give an insight into your bots’ performance. With the data in hand, you can get a better understanding of what parts of your chatbot work and what interactions require additional improvements.
The Reports section provides in-depth knowledge about your chatbots. You can analyze interaction occurrence, compare bot flows, browse data from various periods, and much more.
The Starter plan is limited to All chats, Paid chats, All messages, Average messages and All users.
All ChatBot reports are available for Team, Business and Enterprise plans.
The Starter plan is limited to All chats, Paid chats, All messages, Average messages and All users.
All ChatBot reports are available for Team, Business and Enterprise plans.
To view the statistics, go to your dashboard and click the Reports icon on the left sidebar. You can organize your data by Stories (chatbots), integrations and time. In the Reports, you can find main 4 sections:
-
Chats – gives you the overall performance of your bots such as the number of all and paid chats and the busiest period presented as a heat map.
-
Messages — provides you with more details about the chatbots’ chats such as the length of average chats and the total number of sent messages.
-
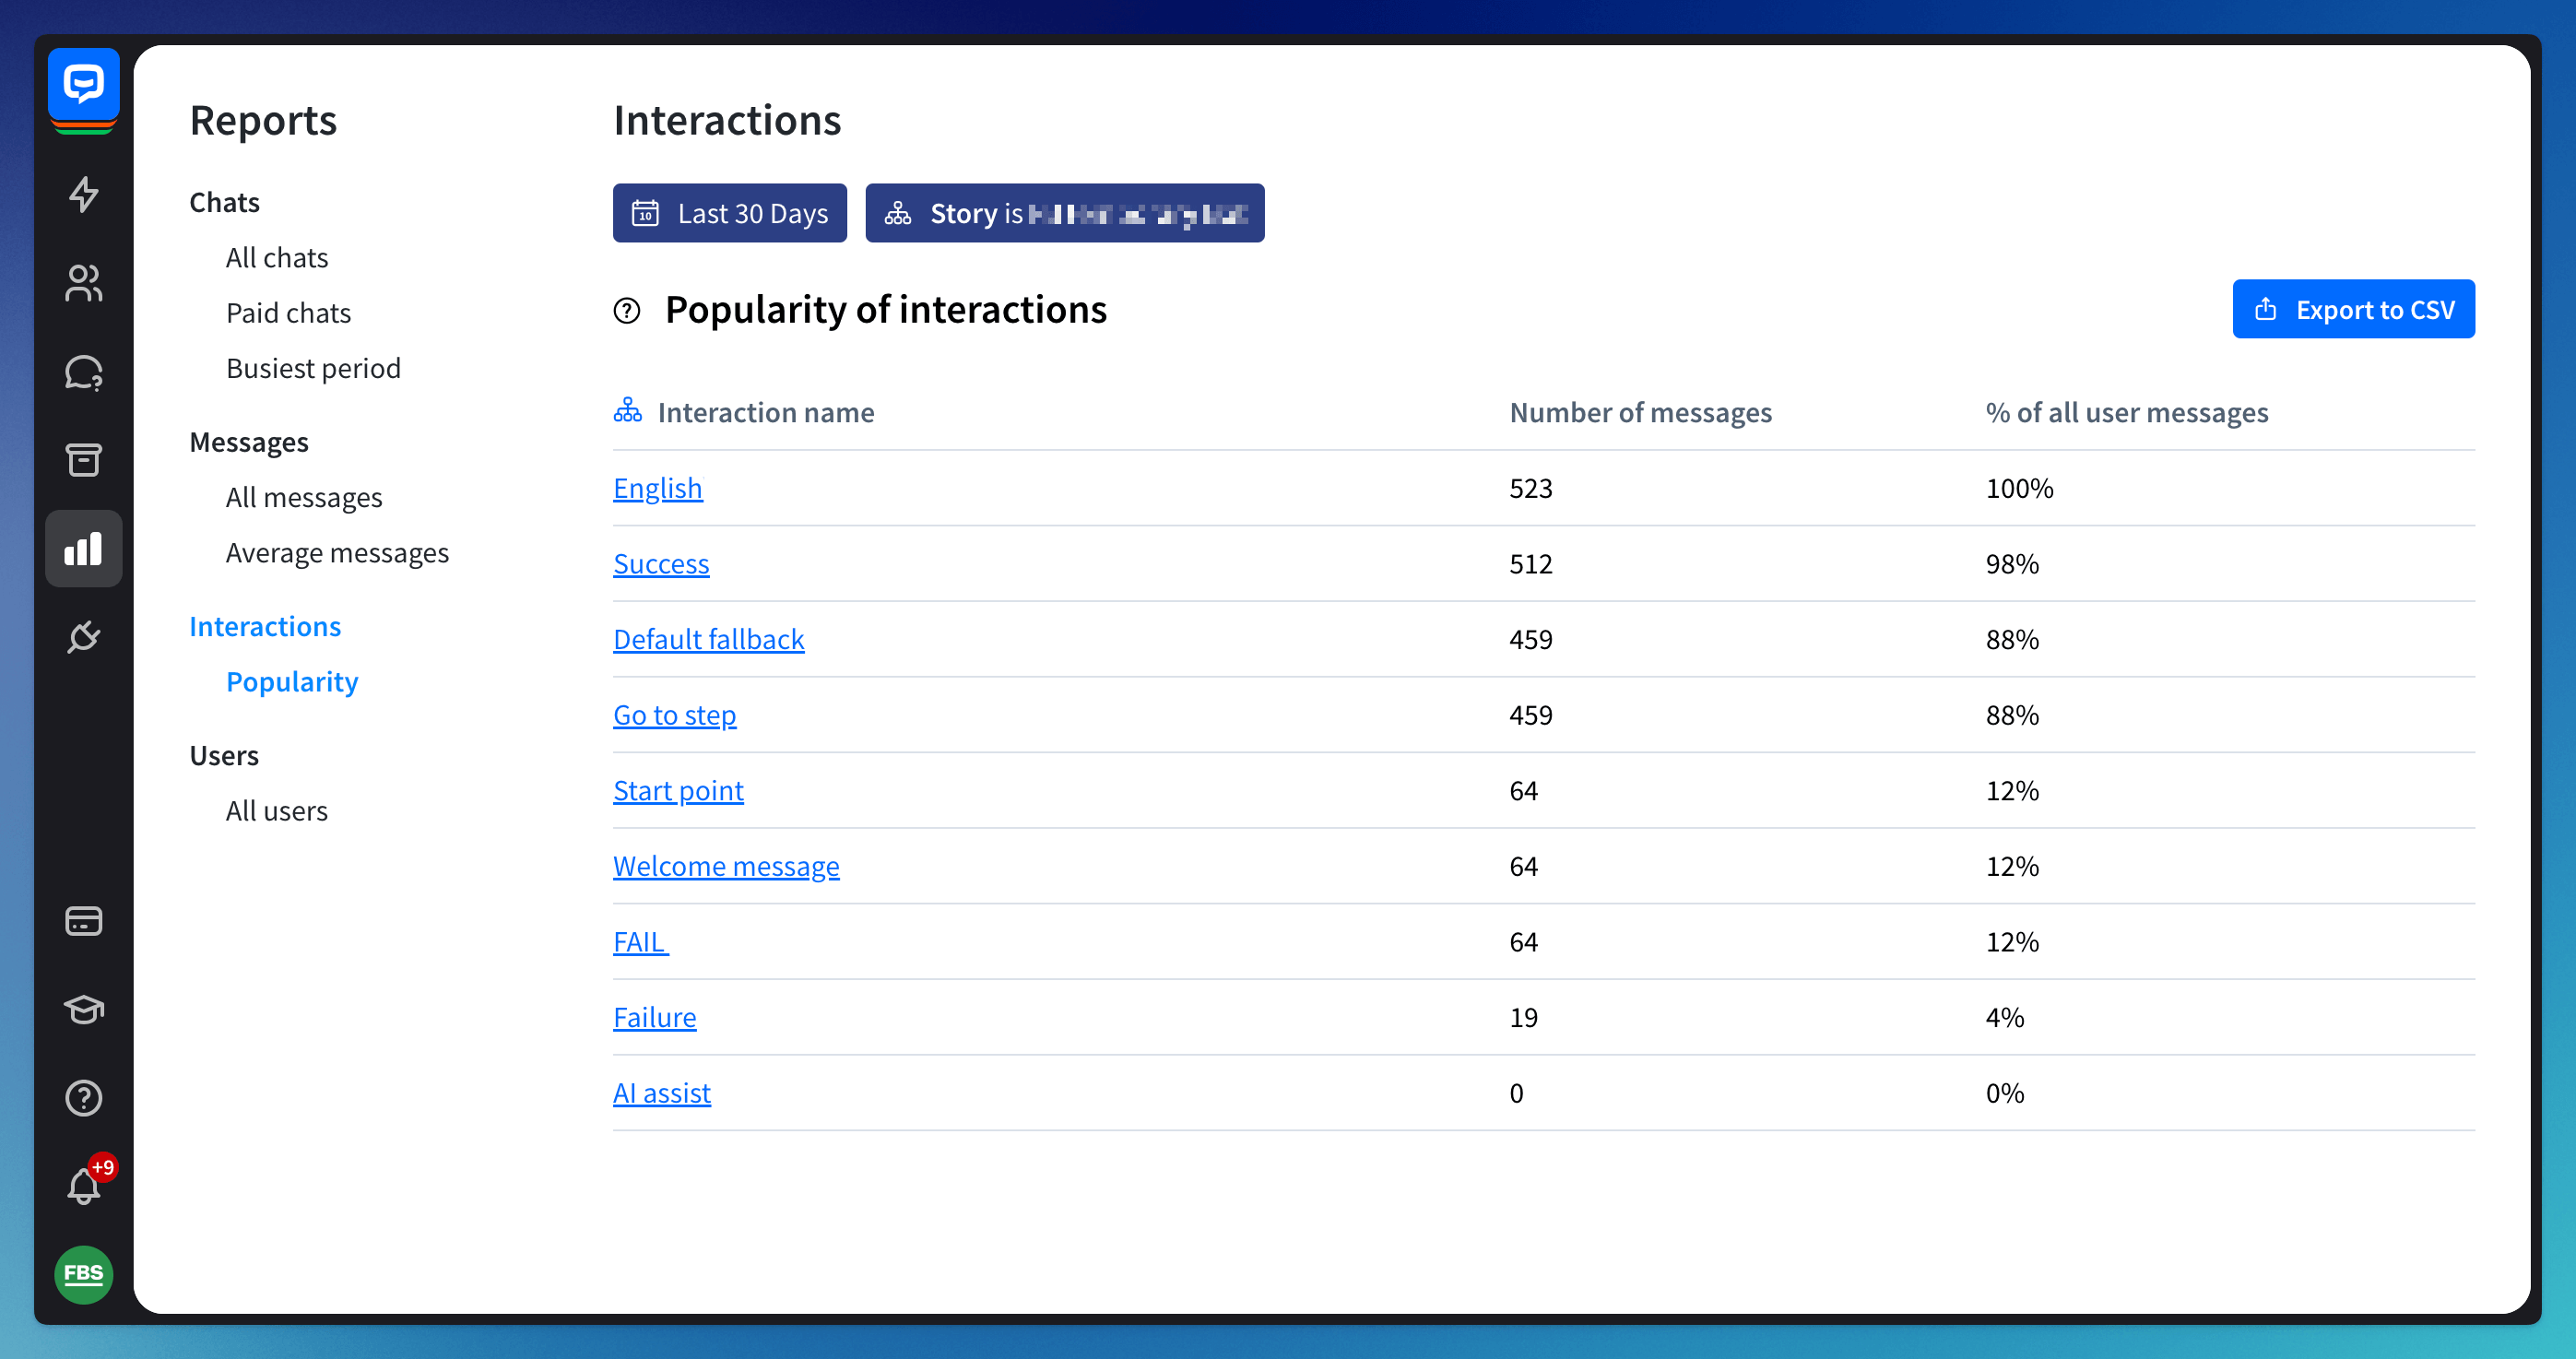
Interactions – lists all interactions sorted by popularity which helps you understand what parts of the Stories are visited the most.
-
Users – shows how many unique users talk to your bot.

Using the export to CSV button, you can easily export the reports as a comma-separated values file (CSV). This will allow you to analyze your chatbots’ data in external applications.
To do so, go to Reports and customize the metric you want to process externally. When you’re ready, hit export to CSV and save the file on your hard drive.
Chats reports
Chats reports can help you understand your chatbot’s overall performance and control its usage over a given time frame.
-
All chats - the total number of chats the bot took in a given time period. That includes your pricing plan chats package and paid and invalid chats.
-
Paid chats - the number of chats that exceeded your pricing plan’s package. Check the pricing page to see how many chats your plan includes.

-
Busiest Period - the heat map highlights the days the bot was active the most. Faded colors show days and time when your bots didn’t get many chats.

A chat is nothing but a conversation between the bot and the user. In ChatBot, we distinguish two types of chats:
-
A valid chat - when the bot triggers at least one custom interaction. For example, a user asks the bot a few questions that the bot answers.
-
If a user comes in, asks ten questions but the bot cannot answer any of them and throws fallbacks, the chat is labeled as invalid. The chat is also invalid when a visitor starts a chat but doesn’t send a message to a bot. Invalid chats aren’t added to your bill.
Messages reports
Message reports give you an insight into how many inquiries your bots receive from users.
-
All messages - the number of messages the bot receives in a given period.
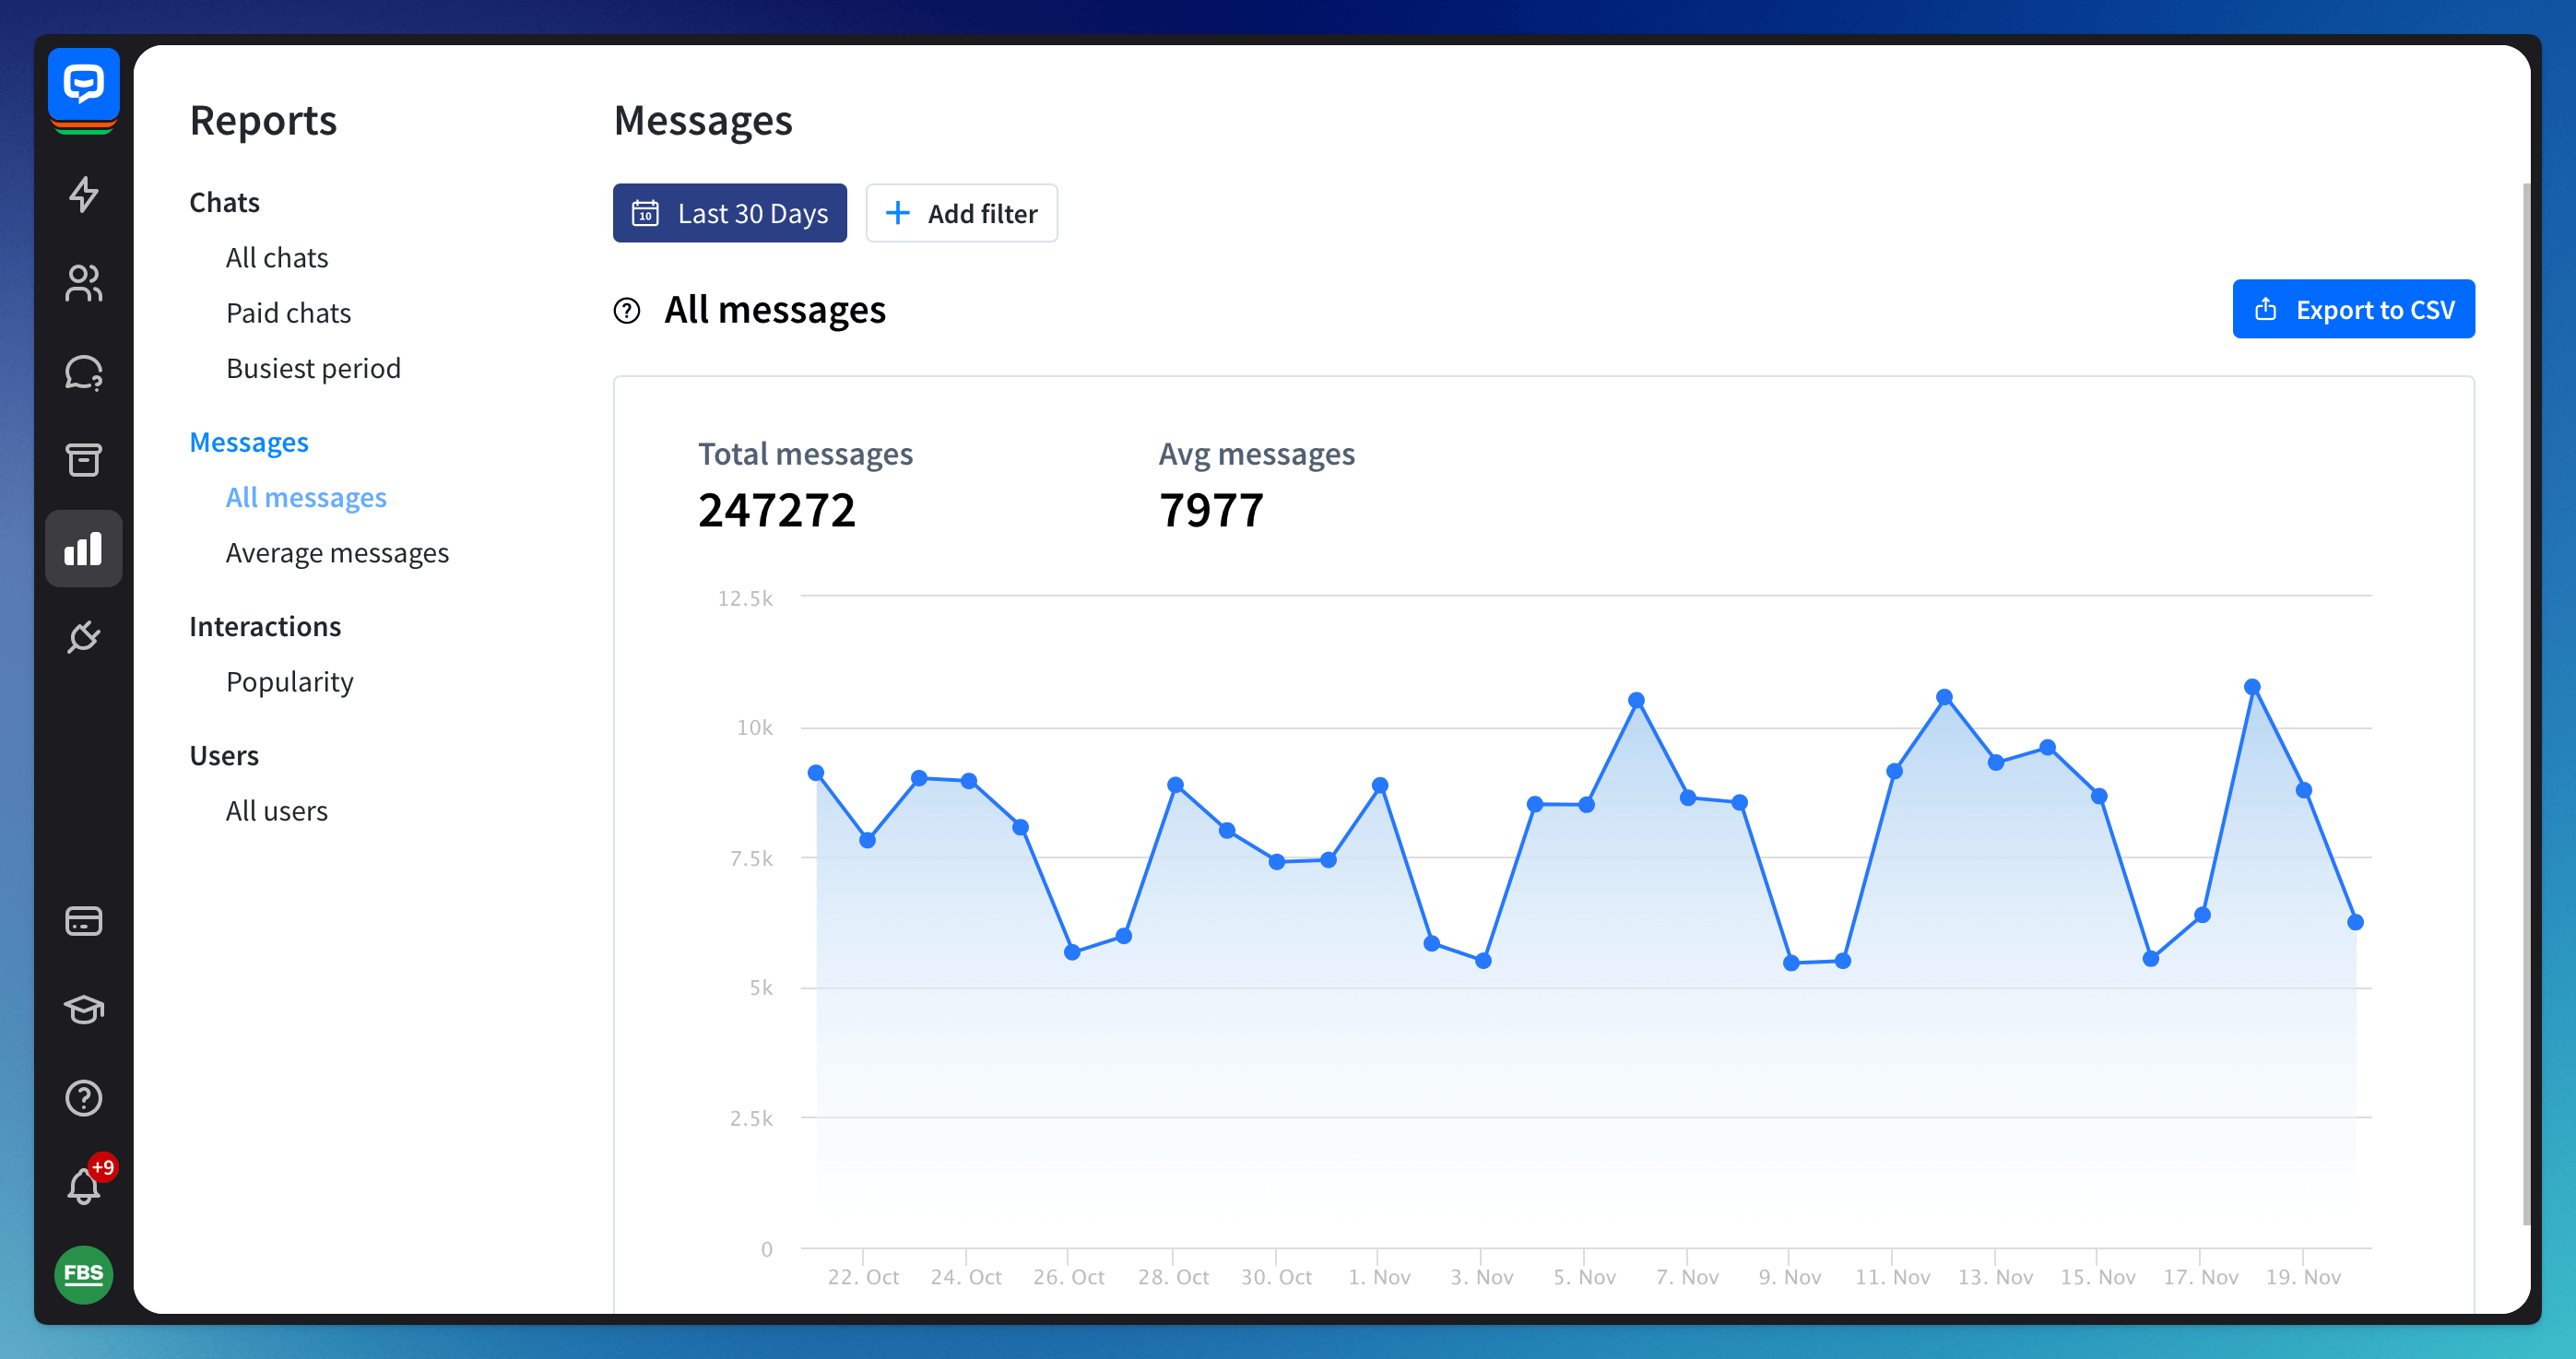
-
Average messages - the average number of messages the bot received during a single chat in a given period.

Interactions section
The Interactions report lists interactions ordered by their popularity. On the top of the list, you can find parts of your bot that were triggered the most and on the bottom, the least or never.
This knowledge can help you discover which parts of your flows are commonly triggered and which topics are not requested by users.
Users section
The All users metric equips you with valuable information on how many unique returning customers have previously talked with your bot. If you compare this metric with the number of chats in a given period, you will see how many users return to chat with the bot again.
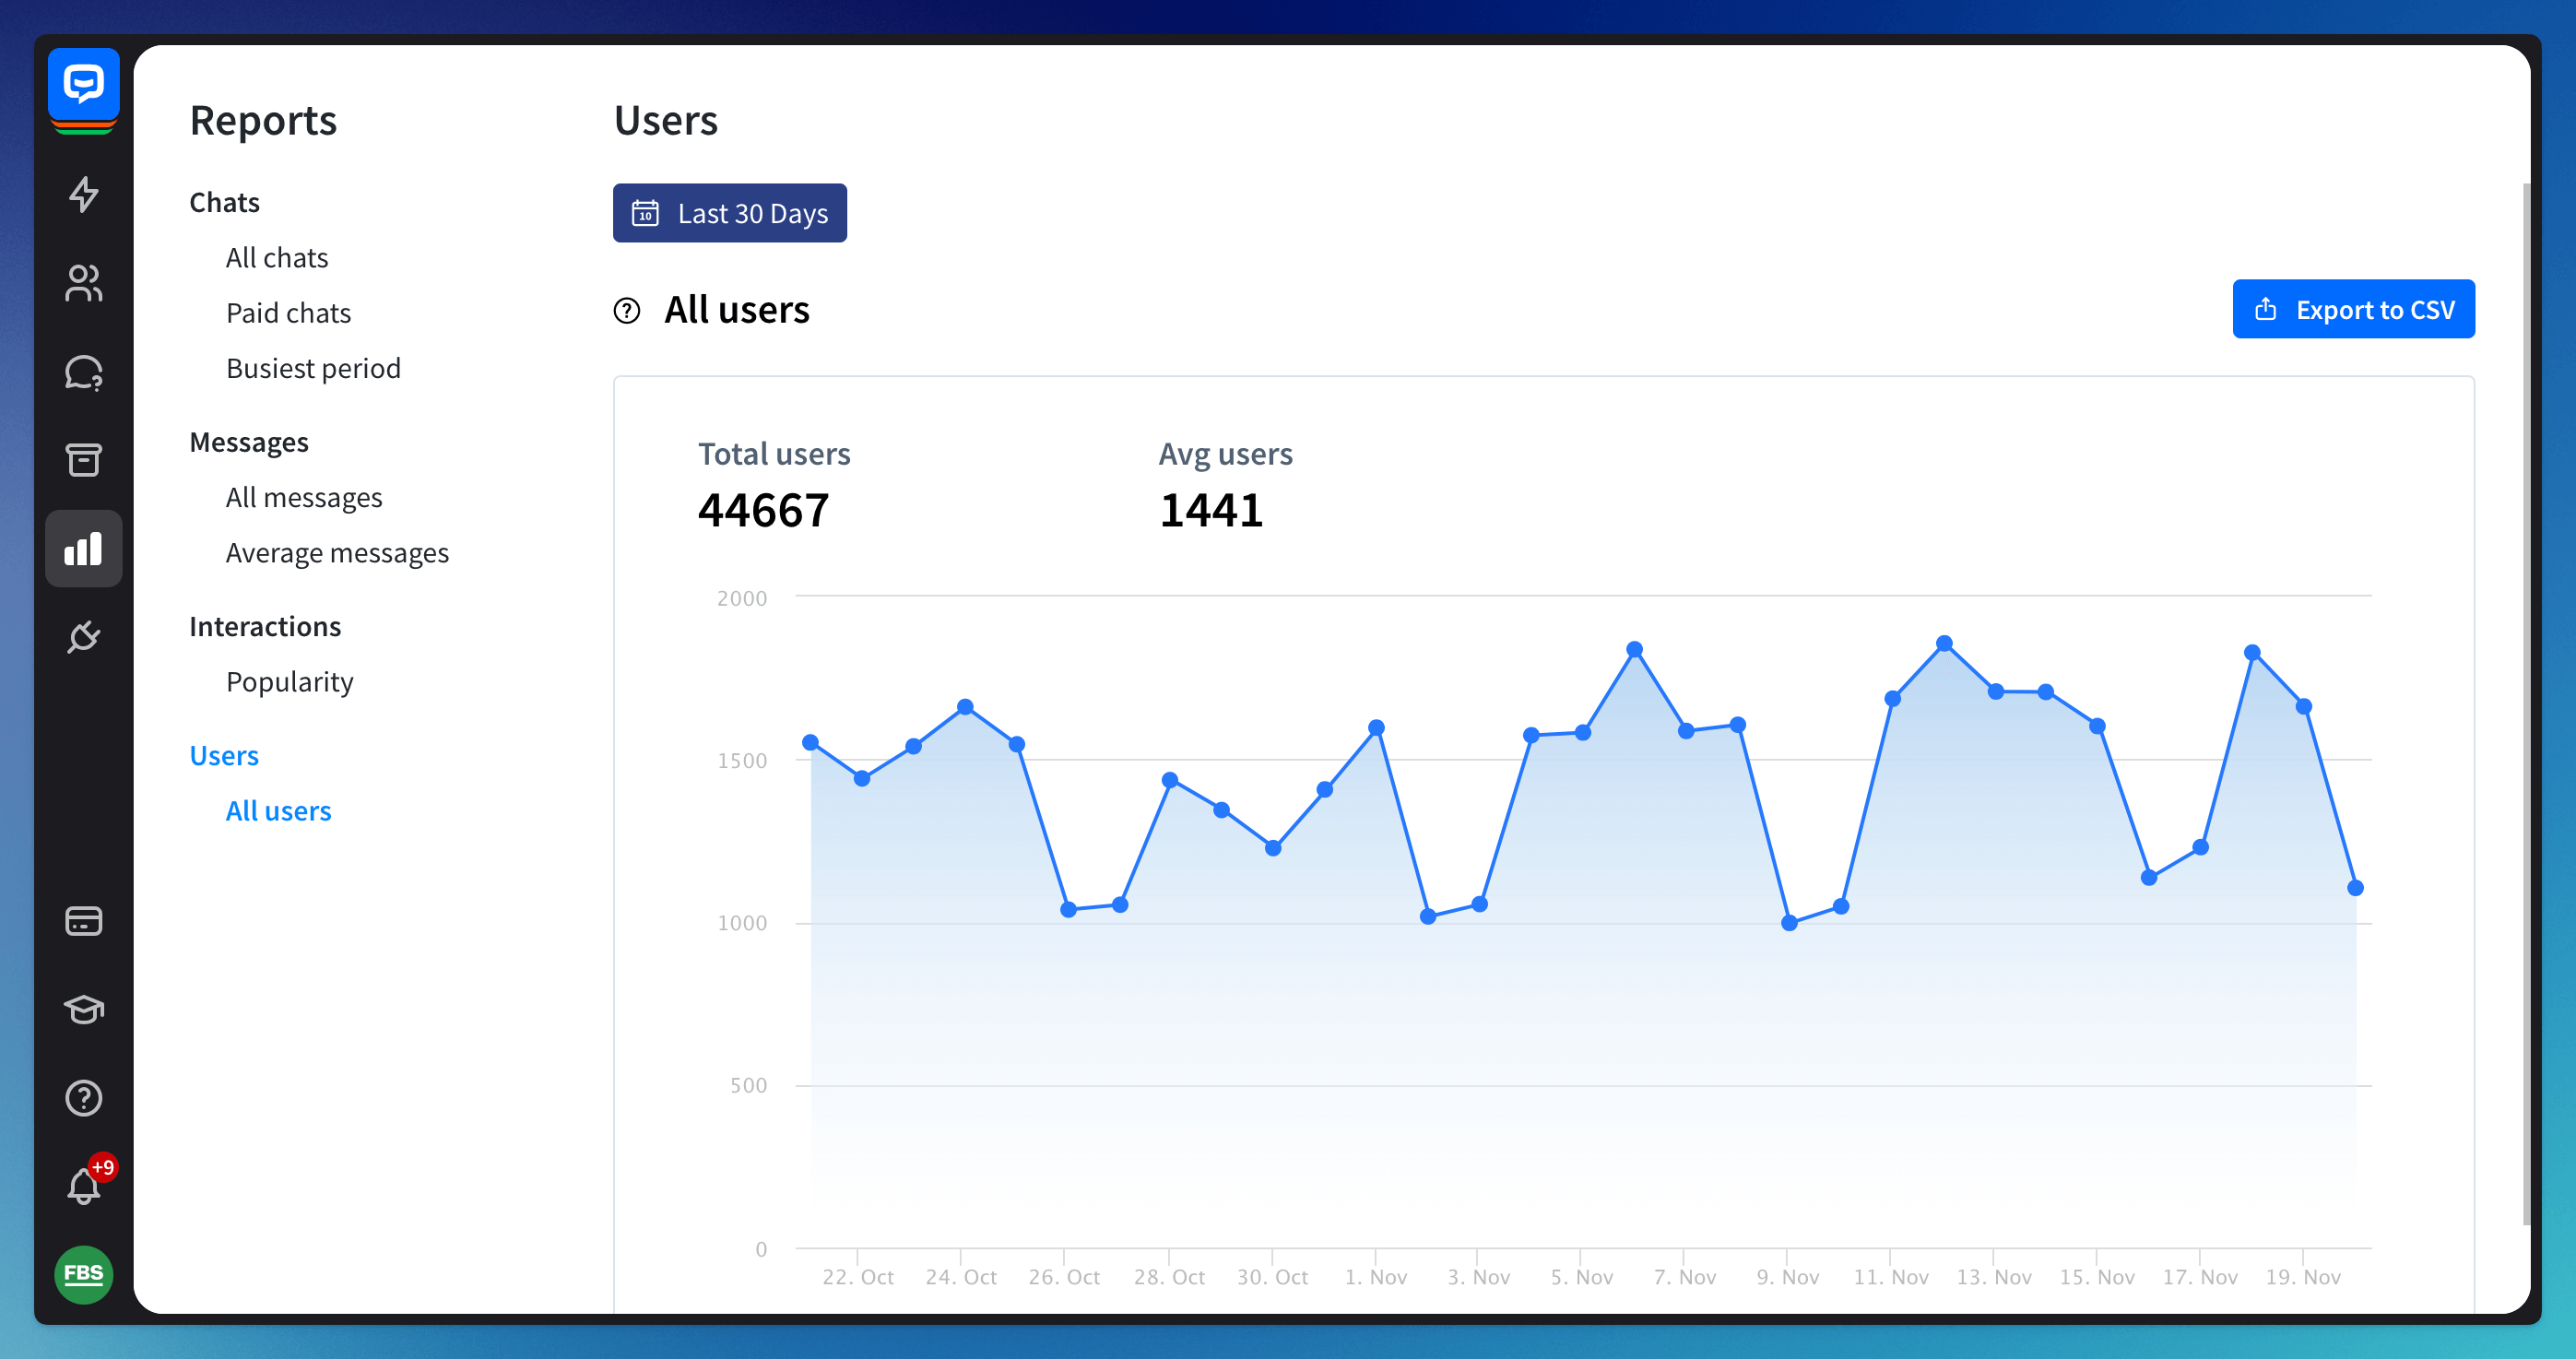 You don’t have many returning users if the numbers don’t differ. If the difference is significant, it can mean that your customers choose to chat again.
Read more:
